

A high Return on Equity (ROE) is often treated like a badge of honor in investing. A company showing a 20–25% ROE immediately looks attractive. But here’s the uncomfortable truth: ROE alone can lie.
Two companies can report the exact same ROE and yet be worlds apart in quality and risk. One may be a genuinely strong business with pricing power and disciplined operations. The other may simply be using heavy debt to manufacture artificial returns.
So how do you separate real performance from financial engineering? That’s where DuPont Analysis comes in. This nearly century-old framework breaks ROE into its core drivers, allowing investors to understand how returns are generated—and whether those returns are sustainable.
The Problem With Looking at ROE in Isolation
Standard ROE is calculated using a single, high-level formula:
ROE = Net Income ÷ Shareholders’ Equity
Simple. Clean. Dangerous.
Imagine two competing companies:
Company A: Earns ₹100 crore on ₹500 crore of equity with little or no debt.
Company B: Earns the same ₹100 crore on ₹500 crore of equity—but carries ₹2,000 crore of debt.
Both show a 20% ROE, but only one deserves your capital. Standard ROE doesn’t tell you how profits were achieved. DuPont Analysis does.
What Is DuPont Analysis?
The traditional DuPont Analysis decomposes the basic ROE metric into three distinct operational and financial drivers:
ROE = Profit Margin × Asset Turnover × Financial Leverage
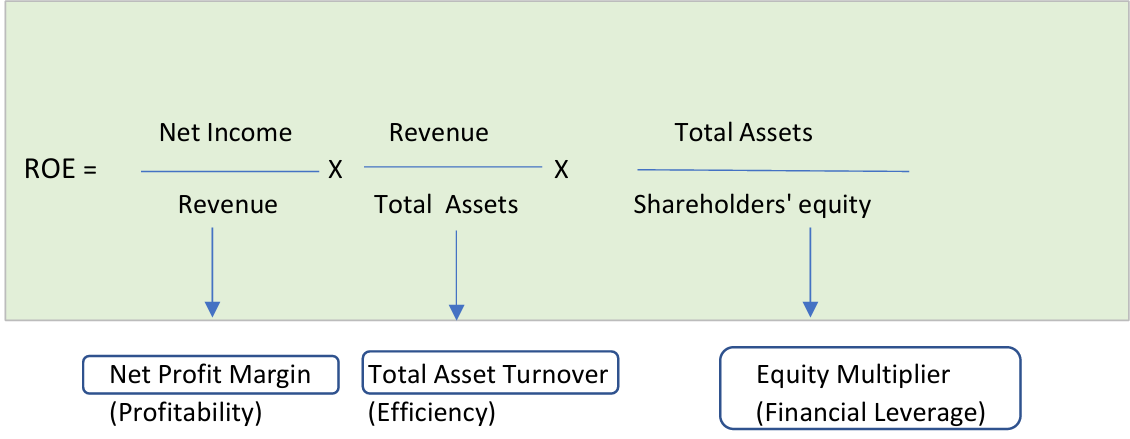
Each component answers a fundamental question about the business model:
Profit Margin: How much profit is made from each rupee of sales? (Operating Efficiency)
Asset Turnover: How efficiently are assets used to generate revenue? (Asset Efficiency)
Financial Leverage: How much debt is being used to boost returns? (Financial Leverage)
Together, these reveal whether a company’s high returns are coming from core business strength or dangerous balance-sheet risk.
The Three Drivers of ROE (Explained Simply)
1. Profit Margin (The Quality of Earnings)
Net Profit Margin = Net Income ÷ RevenueThis shows how much of each rupee earned actually turns into bottom-line profit. High margins usually signal strong pricing power, cost discipline, or a competitive moat (like FMCG leaders or IT services firms). If margins are razor-thin, the business has very little room for error.
2. Asset Turnover (How Hard the Business Works Its Assets)
Asset Turnover = Revenue ÷ Total Assets
This measures asset speed and utilisation. Some businesses operate on thin margins but compensate by selling massive volumes quickly (e.g., retail chains like DMart). Capital-heavy businesses such as infrastructure naturally score lower, which is an industry reality rather than a operational flaw.
3. Financial Leverage (The Risk Multiplier)
Equity Multiplier = Total Assets ÷ Shareholders’ Equity
This shows how much debt is being deployed to magnify returns. Leverage amplifies ROE—but it also magnifies losses. An equity multiplier of $1.0$ means zero debt. A ratio of $5.0$ means 80% of the company’s assets are funded by borrowing. While high leverage isn’t inherently evil, it always demands extreme caution.
3-Step DuPont Case Study: Britannia Industries Ltd. (FY2025)
Using this framework, we can dissect Britannia’s financial performance to see exactly what drives its premium returns:
| DuPont Component | Metric Value | Operational Takeaway |
| 1. Net Profit Margin | 12.14% | Britannia earns ~₹12.14 in profit for every ₹100 of revenue, showcasing healthy pricing power and brand strength in a competitive FMCG environment. |
| 2. Asset Turnover | 2.0x | Generates ₹2 of revenue for every ₹1 invested in assets. This indicates an asset-light, highly efficient distribution and inventory model. |
| 3. Equity Multiplier | 2.16x | Reflects balanced, controlled financial leverage. Assets are funded by a healthy mix of equity and debt without introducing structural balance sheet risk. |
Investor Assessment: This is a high-quality ROE profile. The returns are driven by real operating margins and rapid asset recycling, not manufactured via accounting leverage.
The 5-Step DuPont Analysis: A Deeper Look
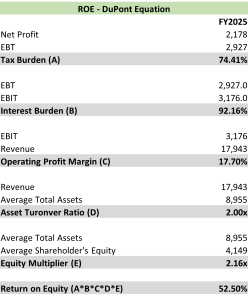
While the traditional 3-step model is great, the 5-step DuPont model goes one layer deeper. It actively separates the direct impact of taxes and interest costs, letting you isolate core operational strength from tax breaks or debt structures.
1. Tax Burden Component
Formula: Net Income ÷ EBT
What it shows: How much profit remains after tax.A higher ratio indicates tax efficiency or a stable tax regime. A lower ratio may reflect higher effective tax rates or loss of tax benefits.
2. Interest Burden Component
Formula: EBT ÷ EBIT
What it shows: Impact of interest costs on profitability.A ratio close to 1 means low interest pressure. A falling ratio indicates that debt servicing is eating into operating profits.
3. Operating Profit Margin
Formula: EBIT ÷ Revenue
What it shows: Core operating strength before financing and taxes.This is the purest measure of business quality—pricing power, cost control, and operating leverage.
4. Asset Turnover
Formula: Revenue ÷ Total Assets
What it shows: How efficiently assets are used to generate sales.High turnover businesses rely on volume and speed, not heavy margins.
5. Equity Multiplier
Formula: Total Assets ÷ Shareholders’ Equity
What it shows: Degree of financial leverage.Higher leverage boosts ROE—but also increases financial risk.
5-Step Model Interpretation: Britannia Industries Ltd. (FY2025)
When applying the deep 5-step model to Britannia, the underlying operational reality becomes completely transparent:
Core Operating Strength Rules: An 18% EBIT Margin combined with a 2.0x Asset Turnover proves that Britannia’s structural returns are generated by excellent business fundamentals.
Minimal Interest Strain: An Interest Burden of 92% indicates that the vast majority of operating profit flows cleanly through to pre-tax income. Debt is present, but it does not distort performance metrics.
Stable Tax Structure: A Tax Burden of 74.4% shows that the company isn’t relying on aggressive tax holidays or temporary loop-holes to artificially inflate its numbers.
Supporting Leverage: With an Equity Multiplier of 2.16x, leverage acts purely as a calculated booster rather than a primary manufacturing engine for their ROE.
Summary: 3-Step vs. 5-Step DuPont
3-Step DuPont tells you where your ROE comes from.
5-Step DuPont tells you why it comes from there.
ROE is a remarkably powerful metric, but only if you choose to dissect what sits underneath it. Britannia’s clean metrics highlight exactly what high-quality earnings look like.
The ultimate takeaway for long-term investors is simple: Don’t just look at the headline ROE figure—dissect it. Long-term wealth is built by completely understanding how returns are earned, rather than chasing a single impressive number.



No comment yet, add your voice below!